
- Industry News
How to Tell If an Electronic Components Supplier Is ReliableLead Time, Quality & Price Evaluation Framework
- By tian81259@gmail.com
When you build power supplies, industrial controls, consumer electronics, or automotive modules, your product is only as reliable as the components that go into it. A single bad batch of resistors, MOSFETs, or connectors can trigger line stoppages, scrap, field failures, and angry customers.
That’s why choosing a reliable electronic components supplier is one of the most critical decisions for purchasing managers and hardware engineers.
This guide walks you through a practical framework to evaluate suppliers based on lead time, quality, and price, with a quantitative scorecard table you can adapt for your own vendor audits.
1. What “Reliable Supplier” Really Means in Electronics
In the context of electronic components, a “reliable supplier” is not just the one with the lowest quote.
A truly reliable supplier should:
- Deliver on time, consistently, even during demand spikes
- Maintain stable quality with traceability and documented processes
- Offer fair, transparent pricing and reasonable terms
- Protect you from counterfeit and gray-market risks
- Support your engineers with technical documentation and samples
- Communicate early about PCN/EOL, shortages, or logistics issues
If you’re still building your internal component knowledge, it helps to first understand the basics of specs and parameters; a good starting point is an in-depth electronic component parameter guide so you know exactly what you’re buying before you evaluate who you buy from.
2. First-Pass Checks: Company Background & Credentials
Before you dive into metrics and scorecards, run basic due diligence:
2.1 Legal and business basics
- Registered company information, tax ID, and physical address
- Years in business in the electronics field
- Main customer types: OEM, EMS, distributors, small traders, etc.
- References or case studies (even anonymized) in relevant industries
2.2 Quality and compliance
Ask for and verify:
- ISO 9001 (or higher) quality certification
- Environmental compliance (RoHS, REACH, WEEE where applicable)
- If relevant: IATF 16949 (automotive), AS9100 (aerospace), ISO 13485 (medical)
- ESD control procedures and storage conditions (especially for ICs and MOSFETs)
2.3 Authorized versus independent distributor
- Authorized/franchised distributors for major brands often have better traceability and access to factory support.
- Independent distributors can be flexible on price and availability but require very strict anti-counterfeit and incoming inspection processes.
If you’re still shaping your purchasing process, it’s useful to align this step with a broader electronic components procurement checklist so you don’t miss any key risk points.
3. Evaluating Lead Time & Delivery Performance
Lead time is not just the number of weeks quoted in an email. Reliability is about how consistently they hit the promised date.
3.1 Key lead time metrics
Track at least these indicators:
- Quoted lead time (QLT): Weeks from PO to confirmed ship date
- Actual lead time (ALT): Weeks from PO to receipt in your warehouse
- On-time delivery (OTD %):
Number of POs delivered on or before the confirmed date ÷ total POs - Partial shipment rate (%): How often they can’t deliver full quantity
- Expedite success rate: How often urgent pulls are supported
3.2 Example lead time KPI target table
You can use the following table as a starting point for setting expectations:
| Metric | Typical Target for Reliable Supplier | Notes |
|---|---|---|
| On-Time Delivery (OTD %) | ≥ 95% | Measured monthly or quarterly |
| Lead Time Stability | ± 1 week from confirmed date | Frequent push-outs are a red flag |
| Partial Shipment Rate | ≤ 10% of total POs | Higher rate suggests weak inventory control |
| Expedite Support Success | ≥ 70% of expedite requests fulfilled | Depends on your business relationship |
You can adapt the thresholds based on your industry (consumer vs. automotive vs. industrial).
4. Evaluating Quality: From PPM to Failure Analysis
In electronics, quality issues can be subtle and delayed (e.g., intermittent failures, early-life breakdown, thermal stress). That’s why you must treat quality as a data-driven process, not a one-time visual check.
4.1 Critical quality metrics
At minimum, track:
- Incoming lot acceptance rate:
Percentage of lots passed at incoming inspection - Defect rate (PPM / DPPM):
Defective parts per million shipped - DOA rate (%):
Dead-on-arrival units at your test stations - Return & RMA rate:
RMA quantity ÷ total shipped in a given period - Corrective Action Response Time:
Days from your complaint to supplier’s 8D / corrective report
4.2 Example quality KPI table
| Metric | Good Level | Warning Level |
|---|---|---|
| Incoming Acceptance Rate | ≥ 99.5% | < 98% |
| Overall Defect Rate (PPM) | < 500 PPM for general electronics | > 1,000 PPM |
| DOA Rate | < 0.1% | ≥ 0.3% |
| RMA Rate | < 0.05% of shipped qty per quarter | ≥ 0.2% |
| Corrective Action Time | ≤ 10 working days | > 20 working days |
For complex or high-value components (IGBTs, high-power MOSFETs, precision ICs), you may require additional items:
- Detailed failure analysis reports (FA) with root cause and long-term fix
- PCN/EOL management to ensure you’re not surprised by changes
- Controlled traceability down to reel/lot and sometimes wafer
5. Evaluating Price: Total Cost of Ownership, Not Just Unit Cost
Many buyers still focus on the cheapest quote. In electronics, that’s often the most expensive long-term decision.
When you evaluate pricing, look at total cost of ownership (TCO):
- Unit price vs. global market level (use multiple quotes where possible)
- Impact of MOQ and lot size on your inventory and cash flow
- Shipping, duties, and insurance cost, especially for cross-border trade
- Payment terms (Net 30, Net 60, letter of credit, pre-payment, etc.)
- Cost of quality issues (rework, scrap, field returns, brand damage)
- Cost of line stoppages when lead time commits aren’t met
A supplier with a slightly higher unit price but consistent quality, stable delivery, and strong engineering support may be cheaper overall than a low-price source with frequent delays and defects.
6. Comprehensive Supplier Evaluation Scorecard
Lead Time, Quality & Price Composite Table
To make decisions objective and repeatable, build a weighted scorecard that assigns scores to each dimension. Below is a practical template you can adapt:
6.1 Suggested weighting
- Quality & Reliability: 40%
- Lead Time & Delivery: 30%
- Price & Commercial Terms: 20%
- Service, Communication & Support: 10%
6.2 Example supplier evaluation table (1–5 scale)
| Category | Weight | Supplier A Score (1–5) | Supplier B Score (1–5) | Weighted Score A | Weighted Score B |
|---|---|---|---|---|---|
| Lead Time & Delivery Performance | 0.30 | 4 | 3 | 1.20 | 0.90 |
| Quality & Reliability | 0.40 | 5 | 3 | 2.00 | 1.20 |
| Price & Commercial Terms | 0.20 | 3 | 5 | 0.60 | 1.00 |
| Service & Engineering Support | 0.10 | 4 | 3 | 0.40 | 0.30 |
| Total Composite Score | 1.00 | 4.20 | 3.40 |
How to use this table:
- Define a clear rating scale (e.g., 1 = poor, 3 = acceptable, 5 = excellent).
- Score each supplier based on your real data (OTD %, PPM, RMA, response times, etc.).
- Multiply each score by the category weight to get the weighted score.
- Sum the weighted scores to compare suppliers objectively.
You can also set internal thresholds:
- ≥ 4.0: Preferred / strategic supplier
- 3.0–3.9: Approved but needs monitoring or improvement plan
- < 3.0: High-risk supplier; approve only for non-critical or last-resort sourcing
7. Red Flags: When You Should Think Twice
While numbers matter, there are qualitative warning signs you should never ignore:
- Reluctance to share basic documents: ISO certificate, test reports, RoHS/REACH declarations
- Inconsistent or unverifiable lot labels and traceability codes
- Quotes significantly below market with no clear explanation
- Unclear origin of goods or refusal to declare whether parts are new, surplus, or refurbished
- Vague answers on ESD handling, storage conditions, and shelf life
- Slow or defensive reaction when you raise quality issues
- No structured process for PCN/EOL communication
If you encounter several of these red flags, treat the supplier as high risk regardless of the price.
8. Building a Long-Term Partnership, Not Just a Price List
The best sourcing results come when you treat your supplier as a partner, not a one-time auction winner.
Practical steps:
- Share your 12-month demand forecast to help them plan inventory
- Align on quality targets (PPM, DOA, OTD) and review them quarterly
- Involve their engineers early when choosing alternative components or second sources
- Co-develop continuous improvement plans after major issues
- Visit their warehouse and quality lab if possible, or request remote audits
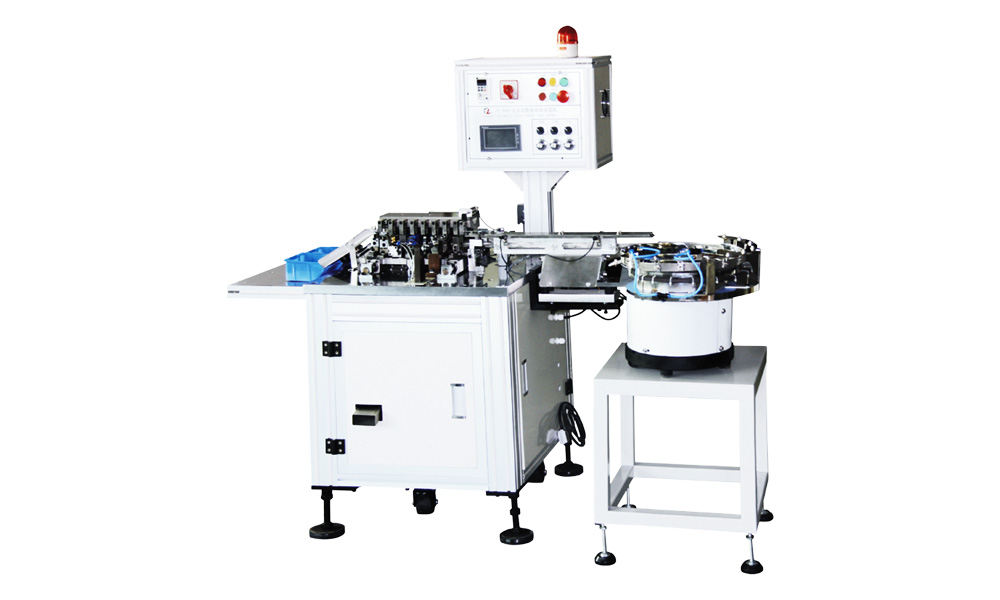
If your manufacturing process includes high-volume cutting, bending, or forming of resistor and capacitor leads, integrating reliable suppliers with robust in-house processing – for example, using dedicated electronic component lead forming machines – can dramatically reduce handling damage and variability between lots.
9. Putting It into Practice: Next Steps for Your Team
To turn this framework into daily practice:
- Standardize your evaluation sheet
- Use the composite scorecard above as a template.
- Customize weights and rating rules for your business.
- Align purchasing and engineering
- Purchasing tracks price, delivery, and contracts.
- Engineering tracks technical fit, quality trends, and field feedback.
- Use joint reviews before approving or disqualifying a supplier.
- Document and review regularly
- Update supplier scores quarterly using fresh data (OTD, PPM, RMAs).
- Keep records so you can justify decisions during audits or customer visits.
- Train your team
- New buyers and engineers should master component basics.
- A structured reading path using your own content – such as an overarching electronic component parameter selection guide and a step-by-step electronic components procurement guide for purchasing managers – can quickly bring them up to speed.
A reliable electronic components supplier is not found by accident; it’s built through structured evaluation, clear expectations, and continuous improvement. By combining lead time, quality, and price into a transparent scorecard – and by watching for both data trends and red flags – you can significantly reduce risk, stabilize your production, and protect your brand in the long run.
Share the Post:
Related Posts

20 Years of Expertise, Trusted by Clients Worldwide
The Preferred Choice of Foxconn, BYD, and Huawei